Free Trade Agreements and economic openness bring social welfare. Few days ago, there were some colombians who complained this economic policy, but there were not solid support on them. Economic theory and evidence shows that economic openness gives social benefits, so this note shows it through Make Up market in Colombia between 1991 to 2012. This market has taken economic openness benefits through more Foreign Direct Investment (FDI) and free tariff trade. Colombia has more foreign firms in this economic sector and has exported more volume of these products. Moreover, this sector increased job places about 2.3% per year between 1991 to 2012. However, Make Up’s prices in local market are high, so the volume exported by Colombia is cheaper than the volume supplied in local market; therefore, there is place to more firms to be efficient; it means new firms can charge low prices and get profits.
Author: Humberto Bernal,
Economist,
e-mail: zhumber@gmail.com
Twitter: Humberto_Bernal
There has been complaints on Free Trade Agreements (FTAs) signed by Colombia recently, nevertheless these complaints do not give economic support in many cases. The worst thing is society takes by sure these gossips about FTAs. Moreover, it is too early to grade FTAs signed recently with Canada, the United States and many others. FTAs take time to bring social benefits, but firms and consumers will enjoy them at the end. Colombia started her economic openness in 1991, and there are sectors that are enjoying it. This note shows economic benefits from this economic openness for Make Up market in Colombia.
In this case, Make Up market takes two products: Eye Make Up Preparations and Solid Products for Making Up; there are others products in this market, but they are not taking into account in this note because lacking of room; however, it is easy to work on them.
The Make Up market in Colombia is big. This market shows a real annual growth of 2.5% between 1992 and 2011. Moreover, its Added Value in Colombia economy shares between 1.2% and 2.2% of total Gross Domestic Product (GDP) as figure 1 shows. This share shows a decline trend because Colombia GDP has other products that has shown higher growth such as crude oil, coal and ferronickel, so government has to pay attention to Dutch Disease impact on sectors with strong global competitiveness such as Make Up sector. However, this market is so important in Colombia economy still; the job places in Body Care Products increased from 38,686 places in 1992 to 62,786 places in 2011; it means an annual growth of 2.3% between 1992 and 2011.
Figure 1. Make up GDP* as a share of total GDP in Colombia 1995-2012
(annual %)

*ISIC: D2424 Rv.3.
Source: Superintendencia de Sociedades and Bureau of Statistics Colombia (DANE).
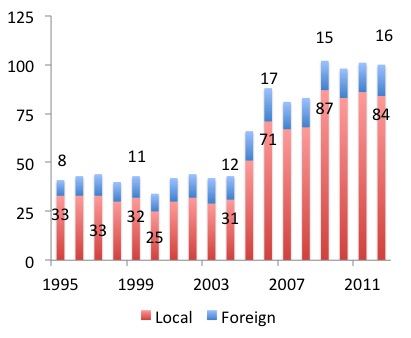
Make Up market is enjoyed by local firms and foreign firms. At the beginning of 90’s, there were 41 big firms where 33 were locals and 8 were foreigns, but the volume of firms increased to 100 in 2012; by this last year, 84 were locals and 16 were foreigns as figure 2 shows. Some of foreign firms in Make Up market in Colombia are Henkel from Germany, Mercantil Belleza from Luxembourg, Procter and Gamble from Switzerland, Capill France based in Panama and Yanbal Colombia from Peru and based in Bermudas. Most of these firms are located in Bogotá, Barranquilla, Cali and Medellín.
Figure 2. Make Up firms by nationality 1995-2012
(annual number)
*ISIC: D2424 Rv.3.
Source: Superintendencia de Sociedades and Bureau of Statistics Colombia (DANE).
The volume of Make Up exported has shown an important increase since 1991. This volume went from 37 tonnes in 1991 to 784 tonnes in 2012 as figure 3 shows; it means an annual growth rate of 15.6% between 1991 and 2012!!!. The main countries that imported these products from Colombia were Ecuador with 21.8% of total Make Up value exported in 2012; Mexico with 19.7%; Peru with 15.2% and Chile with 12.6%, so the market for these products are medium and low medium income countries.
Figure 3. Make Up exports* from Colombia 1991-2012
(annual tonnes)

HS Code: 330420.
Source: ONU Data.
Make Up market in Colombia shows Economies of Scale
Make Up market shows Economies of Scale in Colombia. It is interesting to know why this market blasted off through these last 12 years. Economic theory and economic evidence give the answer, so this market took Colombians experience on chemical that started at the beginning of XX century and set up it during 1935 to 1960. Moreover, this market took product differentiation as mechanism to be competitive and to achieve economies of scale. In addition, the economic openness in 1991 brought foreign capitals and opportunities to export these products in easy way. In quantitative measures, its market supply curve shows a negative slope because of economies of scale as table 1 shows. This results can be taken as the price decreases in 1.0%, then volume increases in 2.22%; this result is controlled by crude oil price as raw costs. On the other hand, its market demand curve follows the Law of Demand; so its slope is negative. This results can be taken as price increases in 1.0%, then the volume demanded decreases in 0.74%; this result is controlled by GDP per capita in Colombia.
Table 1. Make Up’s Supply and Demand function*
(variables in logarithm levels. 3SLS model used**)
Variable
|
Volume Supplied
|
Volume Demanded
|
Price
|
-2.22
|
-0.74
|
GDP per capita
|
2.84
|
|
Crude oil price
|
1.64
|
|
Constant
|
17.29
|
-29.42
|
R2
|
0.54
|
0.61
|
*ISIC: D2424 Rv.3.
** Nominal variables were transformed at 2012 chained prices. The total number of observations were 20 (from 1992 to 2011) and significative under 1,500 Bootstrap replications.
Source: Bureau of Statistics Colombia (DANE) and own calculation.
The volume and price expected for Make Up products pointed above are US$91 per kilogram in 2013 and 870,398 kilograms in 2013 as figure 4 shows. These results take into account a GDP per capita growth of 3.5% and a crude oil price of US$113 per barrel; these results are for local market. However, it is fair to point that Make Up companies charge higher prices in local market than countries where they export their products; for example, in 2012, the local price was US$80 per kilogram while they traded same volume for US$30. Moreover, the international price of these products was US$51 per kilogram in 2012. One tends to think that Colombia has economies of scale in these products, but local consumer are facing higher prices than foreign ones, so Make Up companies could reduce their local price and gain more market; another option is to promote this sector to bring more competitiveness in order to reduce local prices. There can be other option to explain these low prices for exported Make Up products, so foreign firms can be applying transfer prices, but one tends to think that nowadays firms are fair in their international transactions.
Figure 4. Make up market expected equilibrium* in Colombia for 2013
(price in US$ dollars per kilogram)

*ISIC: D2424 Rv.3.
Source: Bureau of Statistics Colombia (DANE) and own calculation.
No comments:
Post a Comment