Sunday, January 26, 2014

FDI in crude oil sector in Colombia: new evidence. Part II:1951-2013

When Colombians learned to produce crude oil in 1951, they decided to do it through government firm Ecopetrol and new types of contracts where foreign firms were welcome also. Through last half of XX century and the first years of XXI century, Colombia has changed her economic model to extract crude oil. These changes worked, but the terrorism, public corruption in royalties management and lack of discoveries have pushed down the crude oil sector. Nowadays, Colombia has crude oil reserves for next 6 years and in the best of the cases for next 10 years. These facts can be taken as the sunset of crude oil production in Colombia.

Author: Humberto Bernal,  
Economist,
Twitter: Humberto_Bernal


After 1951 Colombia government decided to change the type of economic model for producing crude oil, but the result was negative in crude oil production. These changes started with government participation in crude oil production in De Mares concession through government firm Ecopetrol; moreover, the type of crude oil contract changed from concession to association in 1969; it means that government took part in all crude oil production that were run by foreign firms or local private firms. However, because of Colombia faced Balance of Payment crisis at the beginning of 50’s, local authorities decided to take control of exchange of rate in order to get foreign currencies to sort out this  crisis and government regulated the crude oil price in favour of getting  public revenues; therefore, foreign firms decided to reduce the FDI in crude oil sector in Colombia;  between 1958 and 1976 the outflows of FDI in crude oil sector in Colombia reached US$32 million (US$273.2 million in 2012 prices); moreover, the low price of crude oil before 1973 contributed to these outflows of FDI from Colombia.

Figure 1. International crude oil price
(WTI, US$ in prices of 2012)
Source: Historical Data British Petroleum.

The low FDI in crude oil sector that brought a high reduction in crude oil reserves between 1951 and 1976 pushed government to make deep changes in crude oil sector. The crude oil reserves in Colombia went from 1,196 million of barrels in 1951 to 472 million of barrels in 1976; this high reduction in reserves let government to change the policy of exchange rate from regulated to free, and trading the crude oil barrel according to international prices. Moreover, the volume of crude oil exported by Colombia was null between 1975 and 1985, so Colombia missed important revenues when crude oil price was high.

Figure 2. Crude oil exports fro Colombia
(Annual thousands of crude oil barrels)
Source: Central Bank of Colombia.

Because of policy changes in crude oil sector at the end of 70’s, the FDI into crude oil sector in Colombia increased and let improving crude oil reserves. After government  changed the crude oil economic policies, the FDI into crude oil sector went from negative  values (outflows) to an average of US$364 million per year between 1977 to 1998 (US$513 million of 2012). Between these years there were important discoveries such as Caño Limón Coveñas well in 1983, Cusiana well in 1989 and Cupiagua well in 1993; therefore, the crude oil reserves increased from 472 million of barrels in 1976 to 3,138 in 1994, and Colombia exported  crude oil again. 

After 1993 there were few discoveries that contributed marginally in increasing crude oil reserves in Colombia; it can be explained by high terrorism in Colombia and unfair contracts between government and foreign firms to produce crude oil. Although Colombia got important inflows of FDI between 1993 and 2003, the number of discoveries of crude oil wells were minimum; they were Volcanera y Pauto, Guando and Gibraltar wells. Terrorism in Colombia stared to blow up pipelines; for instance, the number of terrorist attacks (pipelines blown up) went from 65 in 1993 to 261 in 2001; these terrorism attacks could be explained because of society did not get social benefits from royalties from crude oil extraction; it means that royalties management has faced high corruption. Moreover, during 90’s Colombian government changed the taxes system for crude oil firms, and it was disappointed for international firms along the low international price.

The last period of crude oil in Colombia started at the end of 2003, and it can be taken as the sunset of crude oil production in Colombia. Crude oil production in Colombia tried to take off through a new type of contracts under concession type where government firm Ecopetrol was in the list to bid for crude oil areas; moreover security environment improved along better international prices. These facts let increasing the FDI into this sector in Colombia to reach an annual inflow of US$5,377 million in 2012. The foreign firms interested in Colombian crude oil are from the United States, the United Kingdom, Canada, China and India. However, the discoveries such as Rubiales, Pirí, Quifa, Sabanero and Akacías increased the crude oil reserves marginally; nowadays, the crude oil reserves are about 2,410 million of barrels and society faces high corruption in royalties management.

Sunday, January 19, 2014

FDI in crude oil sector in Colombia: new evidence. Part I: 1894-1951

Crude oil and natural gas sector is a main economic sector in Colombia, so there is huge historical and financial work about it. This work has been dealt by researchers from local universities, government bodies and foreign researchers also. However, there is a topic on crude oil and natural gas that has not been dealt still;  it is the crude oil and natural gas perspective from Foreign Direct Investment view. Therefore, this note and my next weekly note will fill this gap. Contributions through this methodology is a complete data series of FDI in crude oil and natural gas sector in Colombia since 1894 and, in contradiction of previous works that point the FDI in crude oil sector as the main one through the first half of XX, I will point that this FDI shows cycles according to international economic scenario and local legislation. Of course FDI as stock in crude oil sector in Colombia reached 47.1% of total FDI as stock in 1928, but it was the peak of the first cycle. 

Author: Humberto Bernal,  
Economist,
Twitter: Humberto_Bernal


Colombia is a small country that economically depends of commodities such as coffee beans, bananas, gold, silver, emeralds, flowers, coal, ferronickel and crude oil mainly; therefore, there are important works about these commodities. In crude oil and natural gas topic important researchers such as universities and government bodies have broadcasted historical and financial information about it. However, these works did not work this sector (crude oil and natural gas) from inflows of Foreign Direct Investment view, so there is a gap that this note and the next one will fill. The FDI in crude oil sector can be divided into three periods: from 1894 to 1950; from 1951 to 2002 and from 2003 to nowadays. This first note will work FDI in crude oil sector in Colombia from 1894 to 1950, and my next week note will work the next periods. I will take FDI in crude oil sector as FDI in both crude oil and natural gas sector; the natural gas investment took relevance since 1960.

The first period of these three is taken because the type of crude oil production was through concession type. The second one was through association between government and private firms; and the final one is  concession type where government firms can take part.

The first period of this FDI in crude oil sector in Colombia is interesting because Colombia did not have crude oil legislation until 1931, but the exploration started at the end of XIX century; moreover, production in high volumes started in 1921 and Colombia started to export this crude oil in 1926. Therefore, fields where crude oil was discovered were managed according to mining legislation and royalties were set up according each field before 1931. Other interesting issue is people use to say that FDI in crude oil sector through this first period was the main one as Twomey (2000) says Pag. 170, but it is not true at all; FDI as stock in crude oil sector in Colombia went from 0.2% of total FDI as stock in 1900 to 47.1% in 1928 and 32.4% in 1951; therefore, there were other activities that took foreigner firms attention such as gold and silver mines, bananas, coffee trade, beer, sugar, metallurgy, textiles, spirits and others consumption goods trade, hotels, banks and public services (public utilities).

Time Line for Foreign Direct Investment in Crude Oil in Colombia

The discovery of crude oil in Colombia comes back to XVI century when the Spanish conqueror Gonzalo Jiménez de Quesada reported that this black liquid was taken by indigenous for shielding their boats, as energy for their fires and as medical purposes. This black liquid was discovered in Middle Valley of Magdalena River and is was called the Infantas’ well. After this date, there were other discoveries such as the well that belonged to Colonel Drake Titusville; it was in middle of XIX century. There was other discovery in Barranquilla city in 1883 that was called Tubará; this project was supported by local and foreign firms through french Luis Striffler; this french had an interesting history in Colombia see Hombre Hicotea(1992) documentary; Turbará well had a productivity of 50 barrels per day as Asociación Americana de la Indistria del Petróleo(2013) says.

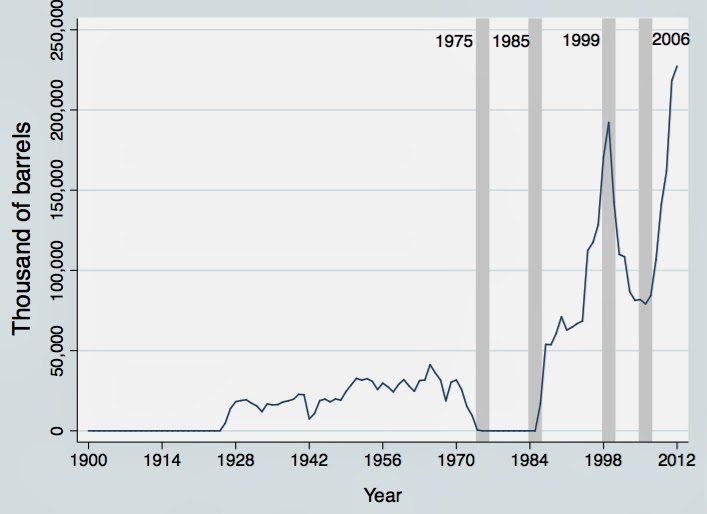
Figure 1. Foreign Direct Investment Inflows in Crude Oil and Natural Gas sector Colombia
(US$ million in 2012 prices)

The first FDI in crude oil registered was in 1894. At the end of XIX century (1880) Jorge Isaac the writer that wrote Maria novel had a crude oil concession in Urabá region (Atlantic Coast) that sold to american firm Panamerican Investment; this concession was sold to this american company in US$40 thousand in 1894 (US$1.1 million in 2012 prices). 

There were small investments before De Mares concession (Infantas well belonged to De Mares concession). At the beginning of XX century (1909) Colombia counted with her first crude oil refinery called Cartagena Oil Refining Co that refined 400 barrels of crude oil imported. By 1911, the Standard Oil from New York decided to do a join venture with Diego Martínez with a total investment of US$90 thousand (US$2.2 millions in 2012 prices). In 1914, this american company and Martínez decided to increase their investment to explore the Sinú region with US$750 thousand (US$17.1 million in 2012 prices); unfortunately their results were disappointed. The total FDI as stock in crude oil sector in Colombia was US$2.0 million in 1914 (US$46 million in 2012 prices) see Lewis (1938) and Ecopetrol (2011).

The beginning of important crude oil production in Colombia was after 1916 through two foreign firms mainly. The first one was the american Compañia de Petróleo de Colombia that arrived in 1917, and it made an investment of US$100 thousand in 1917 (US$1.8 million in 2012 prices); this company was known as Texaco-Mobile multinational years after. The other one was the american Tropical Oil that arrived in 1916. 

An important year for crude oil sector in Colombia was 1919. The concession called Concesión De Mares (Infantas’s well) was bought by three americans through Tropical Oil Company in US$1.5 millions (US$20 million in 2012 prices) and there was an important investment of US$1.0 million (US$13.3 million in 2012 prices) by the Andian National Corporation Limited from Canada to make a crude oil pipe to transport crude oil from Barrancabermenja region (where Concesión De Mares is located) to Cartagena port and to make a refinery in Barrancabermenja. It is import to highlight that the Tropical Oil was bought in US$100 million in 1920 (US$1,327 million in 2012 prices) by Standard Oil from New Jersey, but this transaction was between foreign people; therefore, this transaction can not be taken as FDI into Colombia; moreover, the Andian National Corporation from Canada was a branch of Standard Oil from New Jersey also; the Standard Oil from New Jersey broke their company in order to avoid legal issues that could bring more costs in Colombia. After many investments from americans, the total FDI as stock in crude oil sector in Colombia was US$ 20 million in 1919 (US$285 million in 2012 prices) see Lewis (1938) and Ecopetrol (2011).

After 1919 Colombia started her high production of crude oil. Colombia went from a production 50 barrels per day in 1883 to 200 in 1921 and 17.6 thousand in 1926; moreover, Colombia started to export crude oil in 1926 with a volume of 12.9 thousand of barrels per day see López et la (2012). To achieve this production the foreign firm International Petroleum Company that was the multinational that controlled the Tropical Oil, Andian National Corporation Limited from Canada and Standard Oil from New Jersey invested about US$35 million between 1920 to 1924 (US$470 million in 2012 prices); this investment went to produce crude oil, to transport it and to refine it; moreover in 1925 the Andian National Corporation Limited invested other US$15 million (US$196 million in 2012 prices) to complete the pipe line between Barrancabermeja and Mamonal (Cartagena). By 1929 the total FDI as stock in crude oil sector in Colombia was US$136 million (US$1,835 million in 2012 prices) see Lewis (1938) and Ecopetrol (2011).

Figure 2. Foreign Direct Investment Stock in Crude Oil and Natural Gas sector Colombia
(US$ million in 2012 prices)

Unfortunately, the economic crisis in 1929 and the Second World War brought a reduction of crude oil companies’s capital in Colombia; moreover, the flows of foreign capital in this sector was null until 1939. By 1935 the FDI as stock in crude oil sector in Colombia showed a reduction to reach US$126 million (US$1,668 million in 2012 prices) see Lewis (1938). This reduction was because of lower demand of crude oil and the average crude oil price showed a decline from US$1.6 per barrel between 1920 and 1929 (US$21.3 in 2012 prices) to US$1.0 per barrel between 1930 and 1939 (US$15.8 in 2012 prices).

Nonetheless, between 1940 and 1946 there was a huge FDI in crude oil sector in Colombia because of competition increased and the higher demand of crude oil by the United States and United Kingdom for their war machinery. As foreign firms from the United States, the United Kingdom and Germany realised that Colombia had important reserves of crude oil at the beginning of XX century, so they decided to come through few engineers to explore. However, from 35 firms that sent engineers between 1894 and 1930, there were three that got successful results. Some of these 35 foreign firms where Weetman Person, Shell and British Petroleum from the United Kingdom; Standard Oil and Texas Petroleum from the United States and few Germans that explored La Guajira and Urabá (Atlantic Coast) as Rippy (1976) and Ecopetrol (2011) pointed. The three foreign firms that got a success were Standard Oil and Texas Petroleum from the United Staes and Shell from the United Kingdom-Netherlands. The total FDI as inflow between 1940 and 1946 was US$66 million (US$847 million in 2012 prices); in terms of FDI as stock this volume was US$192 million between 1894 and 1946 (US$2,515 million in 2012 prices). Each of these three firms started to produce crude oil as follow: Standard Oil New Jersey through De Mares (Santander) concession in 1921; Standard Oil New York through Barco (Norte de Santander) concession in 1940; Shell through Yondó (Antioquia), Cantagallo (Bolívar) and El Difícil (Magdalena) concessions in 1941, 1943, 1943 respectively; and Texas Petroleum through Velásquez (Boyacá) concession in 1946.

The end of this first part of crude oil FDI shows a decline because of changing of crude oil legislation in Colombia. The main firm that produced crude oil in Colombia was Standard Oil from New Jersey with 75% of total production in 1950; moreover, the total reserves of crude oil in Colombia was 1,269 million of barrels in 1950, and most of them came from De Mares concession. However, this concession finished in 1951, and these reserves were taken by government firm called Ecopetrol; therefore the age of the government state as supplier of crude oil started. This government movement brought outflows of FDI in crude oil sector in Colombia; in 1950 and 1951 this sector faced an outflow of US$29 million each year (US$276 million in 2012 prices each year); therefore, the total FDI as stock in crude oil sector was US$134 million in 1951 (US$1,983 million).


Bibliography

Ecopetrol. 2011. Energía limpia para el futuro. Villegas Editores. Chapter 1, 2 and 3.

Lewis, C. 1938. American's Stake in International Investments. The Brookings Institution. Pag. 583 and forward.

López, E; Montes, E; and Collazos, M. 2012. La economía petrolera en Colombia Parte I. Banco de la República Colombia, documento de trabajo 692. Pag. 85.

Reppy, F. 1976. The Capitalists and Colombia. Arno press, New York. Pag. 249.

Towmey, M. 2000. A century of Foreign Investment in the third World, Routledge, London and New York. Pag. 170.


Sunday, January 12, 2014

Coca leaf crops sure legalisation in short or long run, meanwhile most of people pay unfair costs

Colombian government and many countries such as the United States are spending more economic resources each year to block the coca leaf production, but production is in the market after 40 years still. Moreover, there is a new way to produce coca leaf in Colombia; it is scattering in small areas of coca bushes around whole Colombia, so it is more difficult to detect the crops to eradicate them. I propose to change the traditional strategy against coca market through legalisation under better economic opportunities for coca farmers and better education about coca effects for whole population (producers and consumers); moreover, the production and distribution have to be managed as a monopoly by international organisation that takes into account royalties for countries that produce coca leaf.

Author: Humberto Bernal,  
Economist,
Twitter: Humberto_Bernal

Colombia is one of main suppliers of cocaine in the World along Peru and Bolivia. The total area of coca leaf crops from these three countries was 133.7 thousand of hectares in 2012 that means 408 thousand of tonnes of coca leaves, or 543 tonnes of pure cocaine in 2012. This 543 tonnes of pure coca can be taken as the total supply of pure coca from the World. It is right to point that Colombia is the country that has more harvests of coca leaf through year; Colombia shows in average 4 harvest of coca leaf through the year while Perú and Bolivia have lower productivity; this information takes Colombia as the main supplier of pure coca around the World with 309 tonnes in 2012, Perú with 175 and Bolivia with 59. In Colombia case, revenues from this activity are taken to afford illegal activities such as guerrillas (FARC and ELN), paramilitaries and other groups outside of the Law. Profits from coca production are huge and its production shows Economies of Scale! as my weekly note of 14 of July of 2013 pointed. Moreover, consumption of cocaine in excess bring health problems such as respiratory arrest, heart attacks and loss of control. However, cocaine is addictive, people sniff it, and most of people can drive it. 

Colombian government along many countries such as the United States and organisations such as United Nations work hard on reducing the production and consumption of this narcotic. This fight has taken economic resources from other activities such as health, education and infrastructure from many countries and from international organisations. In the case of Colombia and the United States (Plan Colombia, see my weekly note of 4 of March of 2012 for resource from Plan Colombia), these resources reached a total of US$5.2 billion in 2012 prices in 2001 and US$14.4 billions in 2012 as figure 1 shows (blue line). It other terms, these annual resources are 4.4% of Colombia Gross Domestic Product. The uses of these resources in Colombia brought down the pure cocaine production from 695 tonnes in 2001 to 309 in 2012 as figure 1 shows (red line), so they achieved their target. However, the fight against cocaine production has taken more than 40 years  (the production for exporting started in 1971 as my weekly note of February 17 of 2013 pointed), and every year this fight demand more money and it is more difficult to eradicate the coca leaves. Moreover, the blood because of this fight is huge, so Colombia has a Homicide Rate of 34 per thousand of inhabitants in 2012 and it was higher before this year!. This note shows that the new way of growing coca leaves is scattering the coca crops in small hectares, so it is difficult to detect them. Therefore, the fight has to be changed through better opportunities for farmers in education, public services such as drinking water and better income; moreover, through legalisation of production and consumption of cocaine under monopoly managed by international agency, and direct education in schools and universities for young where narcotics is the issue.

Figure 1. Defense spending and cocaine production in Colombia 2001-2012
(annual data, US$million in 2012 prices and metric tonnes)
Source: UNODC Colombia and own calculation.

The new way of growing coca leaves in Colombia 

The dispersion of coca leaf crops around Colombia has increased since 2001. According to United Nations, the number of municipalities in Colombia that grow coca leaf increased from 164 out of 1,123 in 2001 to 212 out of 1,123 in 2012; moreover, the number of coca leaf crops lower or equal of 3 hectares has increased  from 47,884 in 2004 to 52,189 in 2011. The GINI coefficient for coca leaf crops has shown a decline since 2001; it went from 0.806 in 2001 to 0.737 in 2012 as figure 2 shows; it means that there are more municipalities that grow coca leaves and hectares used in each municipality are small and better distributed between municipalities. This information lets conclude that coca leaf crops are spreading around Colombia, and it will be more difficult to eradicate it through direct fight.

Figure 2. GINI coefficient for coca crops in Colombia 2001-2012
(annual data)
Source: UNODC Colombia (UN) and own calculation Stata 12.1.

Figure 3. Municipalities with coca leaf crops in 2001
(% share of total hectares with coca leaf crops)
Total municipalities with coca leaf crops in 2001 = 164

Figure 4. Municipalities with coca leaf crops in 2012
(% share of total hectares with coca leaf crops)
Total municipalities with coca leaf crops in 2012 = 212
Label:
yellow, green and blue: percentage of coca leaf crops in each municipality.
Source: Own calculation with information from UNODC (UN).

How can humanity live with coca?

To live with coca, people such as producers and consumes have to be aware about coca effects, and better public services and better income distribution for frames have to be a global policy in order to reduce the dispersion of coca crops; moreover an international organisation has to manage the production and distribution for consumption of pure cocaine. People have to be aware about coca effects in people health; this information can take the producer out of illegal deals; however, this knowledge does not make sense if coca farmers have a low income. Through an econometric model that takes annual information from municipalities that produce and no produce coca leaves between 2006 and 2011, the result is as economic development (legal economic activity) increases in 1.0% in regions of coca production, the number of hectares of coca leaf per capita shows a reduction of 0.04%; moreover, as social programs through Sisbén methodology increase, these type of hectares per capita show a reduction of 0.16% as table 1 shows. There is other important variable that makes low production of coca leaves, and it is the reduction of displaced people or in other terms the end of internal war in Colombia. The impact of 1.0% of lower people displaced lets getting a reduction of coca hectares per capita in 0.23%. Government can work hard on these variables, and get important  results, but the production will be still; therefore, this strategy has to be complemented with legalisation and a monopoly control.

Table 1. Impact on hectare per capita of coca bushes 2006-2011
(annual data, random effects model)
Variable
Coefficient
Economic development
-0.04%
People displaced
0.23%
Poverty program (Sisbén)
-0.16%
Number of observations
905
Number of municipalities
243
Source: UNODC Colombia (UN) and own calculation Stata 12.1.


Bibliography

UNOCD (UN). 2013. Bolivia censo de cultivos de coca.
UNOCD (UN). 2001-2013. Colombia censo y monitoreo de cultivos de coca.
UNOCD (UN). 2001-2013. Colombia Estadísticas municipales censo 31 de diciembre.
UNOCD (UN). 2013. Perú monitoreo de cultivos de coca.

Data Can be download at:


Sunday, January 5, 2014

Better economic growth, but poor income distribution in Colombia. Where are the public policies for middle class in Colombia?

Colombia improved her economic growth in the last semester of 2013 because of government realized that the first semester of 2013 showed low performance. Colombian central government decided to increase her spending in US$1.8 billion in July of 2013; this extra spending let improving the central government cycle, and keeping Colombian GDP on her upward path. Therefore, the GDP’s forecast improved for 2013 and 2014; it is expected that Colombia faces an annual GDP growth rate of 4.3% in 2013 and 5.2% in 2014. This good scenario will be enjoyed by the region and the World; it is expected that Latin America faces an annual GDP growth rate of 2.8% in 2013 and 3.4% in 2014; for the World this figures are 2.7% in 2013 and 3.6% in 2014. Although Colombia can improve her economic growth, there are big issues to sort out by local government that are the income distribution and high unemployment for young professionals such as engineers, chemistries, economists, architects and so.

Author: Humberto Bernal,  
Economist,
Twitter: Humberto_Bernal


The Colombian economic growth in 2013 started with low values in the first semester of 2013, but it took off through the last semester; the first quarter, the Gross Domestic Product (GDP) showed an annual growth rate of 2.5%; on second quarter, this growth rate was 4.0%; on third quarter, this growth rate was 5.1%; and the last one, according to my forecast, can be 5.5%. Moreover, the annual GDP growth rate for 2013 can be between 3.9% and 4.7% with a punctual forecast of 4.3% according to my forecast. This improving in Colombian economy can be partially attached to contra-cycle government spending through whole year as figure 1 shows; therefore the results from this high government spending impacted the economic growth at the end of 2013. The central government spending for 2013 was US$100.3 billions (Col$185,525 billion), but it was increased in US$1.8 billions (Col$3,394 billions) at the beginning of July of 2013, so the total government spending was US$102.1 billions.   This note deals with forecast for Colombian economic growth for 2013 and 2014; fortunately these forecasts go through upward path, but the income distribution is poor still and professional unemployment is getting worst.

Figure 1. Colombian central government spending cycle 1977q1 - 2013q3
(quarterly data)
Source: own calculation through Hodrick-Prescott filter Stata 12.1.

Colombian GDP growth forecasts

The Colombian GDP growth rate for 2013 and 2014 are forecasted under positive scenarios. The first forecast that this note deals is mine. According to time series model called Vector Error-Correction model where government spending, money supply, volume of crude oil , volume of coffee, USA GDP, China GDP, Germany GDP and many other variables were taken to get a proper forecast (see Data on Stata file and Do file). The results are shown in figure 2; the blue data is the Colombian GDP in 2005 prices no seasonally adjusted, and the red line is the Colombian GDP forecasted in 2005 prices. As one can see, the results fits quite well under eyeball and also under statistical tests. If one takes this data to calculate the annual GDP growth rate, the result is a GDP growth rate between 3.9% and 4.7% with a punctual forecast of 4.3% for 2013. In the last quarter of 2013, it is expected that the annual growth rate reaches 5.5%. This data can be taken to do the forecasts for 2014 also; for instance, the annual GDP growth rate for each quarters in 2014 are 5.3%, 5.1%, 5.0 and 5.4%, so it means good perspective for Colombian economy in 2014. Moreover, at the end of 2014 the annual GDP growth rate is forecasted in 5.2%.

Figure 2. Colombia GDP in 2005 prices 1977q1 - 2016q3
(quarterly data Col$ billions in 2005 prices, forecast from 2013q4)
Source: own calculation through time series model VEC Stata 12.1.

Other international and local agencies forecast moderate scenarios for Colombian economy as I did before taking into account the extra government expending. The Colombian GDP growth for international agencies such as International Monetary Found (IMF) is 3.7% for 2013; other international agencies such as ECLAC-UN, the Economist, World Bank forecast this growth in 4.0%, 4.2% and 3.9% respectively. Local agencies such as DNP, ANIF and Fedesarrollo forecast this growth in 4.5%, 3.8%, and 3.8% respectively as table 1 shows. Therefore, at the end the average of these forecasts is 4.0% with a standard deviation of 0.3% for 2013. This improvement in Colombian economy can be attached to increase of government spending after the second semester of 2013 in about US$1.8 billion, so it means government realized the poor economic growth in the first semester of 2013, and she decided to increase her spending through additional resources out of those agreed with Colombian Congress at the end of 2012. 

Latin America and the World will improve their economic growth for 2014 also. According to these agencies shown on table 1, it is expected that Latin America faces an annual GDP growth rate of 2.8% in 2013 and 3.4% in 2014; moreover, the World annual GDP growth rate can be 2.7% in 2013 and 3.6% in 2014.

Table 1. World, Latin America and Colombia GDP growth rates forecasts for 2013 and 2014

Agency
World
Latin America
Colombia
World
Latin America
Colombia
Data of last publication

2013
2014

DNP (Colombia government)


4.5


June 2013
IMF
2.9
2.7
3.7
3.6
3.1
4.2
October 2013
The Economist
2.9
2.7
4.2
3.6
3.6
4.7
January  2014
Colombia Central Bank


4.0


3.0 - 5.0
November 2013
ECLAC (UN)

2.6
4.0

3.2
4.5
December 2013
World Bank
2.2
3.3
3.9

3.9
4.2
June 2013
ANIF (Colombia private firm)


3.8


4.5
December 2013
Fedesarrollo (Colombia private firm)


3.8


4.6
December 2013
Euromonitor
2.9
2.8
3.9
3.7
3.3
4.4
January 2014
Humberto’s 


4.3


5.2
January 2014
Average
2.7
2.8
4.0
3.6
3.4
4.5
Sample
Standard Deviation
0.4
0.3
0.3
0.1
0.3
0.3
Sample